Every NFL betting guide on the internet tells you to “do your research.” I have read dozens of them, and not one explains what that research should look like, where to find it, or how to turn it into an actionable bet. It is the equivalent of telling someone to “eat healthy” without mentioning a single food. After twelve years of analysing NFL wagering markets, I can tell you that “research” without a framework is noise. What follows is the framework.
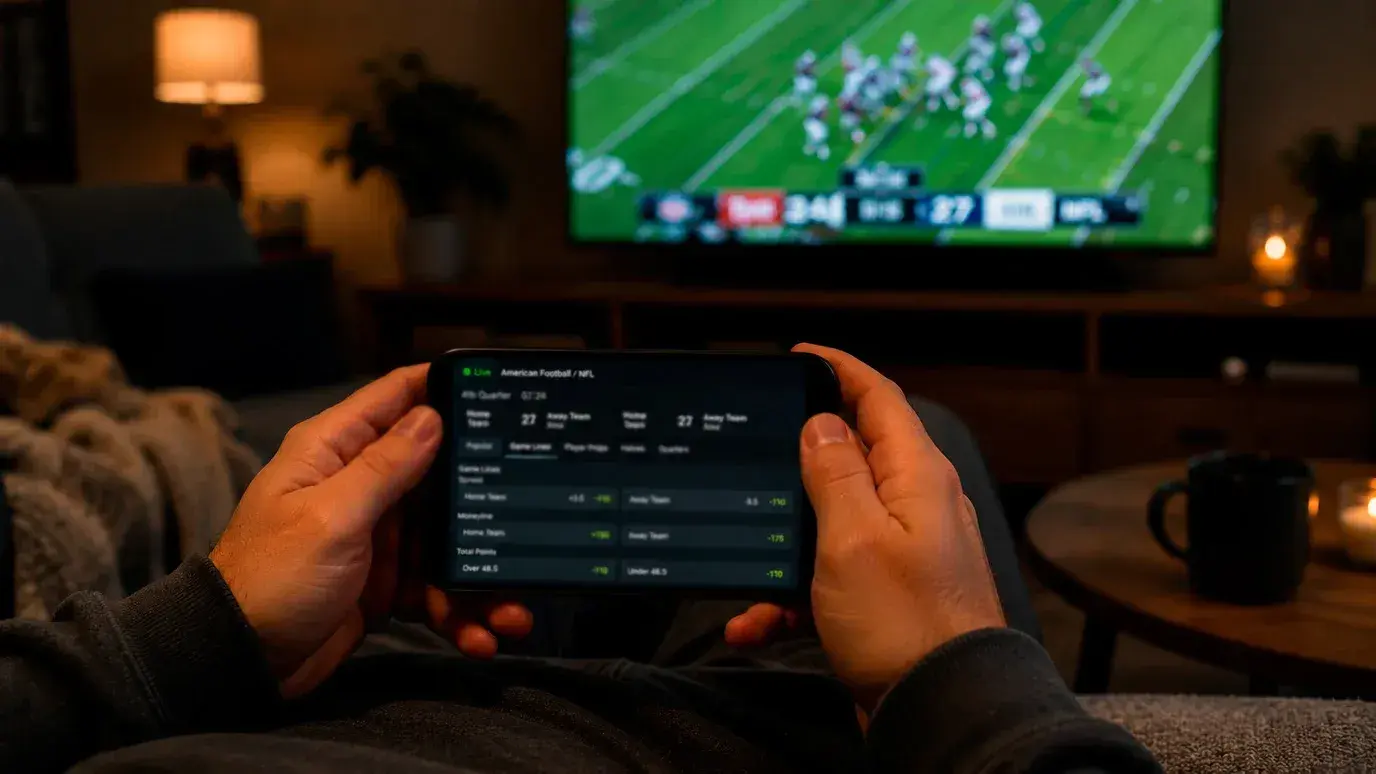
The NFL attracts roughly $30 billion in legal wagers per season across US-licensed operators alone, making it one of the most liquid and efficient betting markets in global sport. That efficiency is both a challenge and an opportunity. It is a challenge because the closing line — the final odds just before kickoff — is remarkably accurate, which means casual analysis rarely beats the market. It is an opportunity because the market achieves its accuracy through a process, and that process has identifiable weak points at specific moments during the week. Research from multiple sources shows that bettors in states with legal sports betting watch approximately 19 more NFL games per season than non-bettors, suggesting that engaged bettors are building an information edge simply by watching more football. This guide is about turning that attention into a system.
To truly master your wagering approach, you must first understand how to effectively read NFL point spreads and key numbers before placing your stakes.
Analyzing Schedule and Rest Advantages in NFL Betting
Three Septembers ago, I built a spreadsheet that tracked every NFL team’s rest days between games for the entire 18-week season. The patterns were not subtle. Teams coming off a bye week covered the spread at a rate consistently above 50%. Teams playing their second game in five days — the Thursday Night Football grind — underperformed. The rest advantage was not a theory; it was arithmetic.
The NFL schedule is an 18-week obstacle course, and no two teams run the same course. Some get their bye in Week 6; others wait until Week 14. Some play three primetime games in four weeks, each on a different day of the week; others have a run of four straight Sunday afternoon slots. These scheduling differences create rest differentials that directly affect performance — and, by extension, the spread.
The key metric is days between games. A standard Sunday-to-Sunday gap is seven days. A team coming off a bye has fourteen. A team playing Thursday after a Sunday game has four. The historical data shows that each additional day of rest is worth roughly 0.5 to 0.75 points against the spread, with the effect concentrating at the extremes. A ten-day rest advantage (bye week versus short week) is worth three to four points of implied spread value — more than enough to flip the outcome of a close game.
Where the schedule edge gets interesting for UK bettors specifically is in the London Games. Teams travelling to London face a unique logistical challenge: a transatlantic flight, a five-to-eight-hour time zone shift, and an unfamiliar stadium. The “home” team in London is not really at home — they have usually been based in the UK for a week, but they are still playing in a neutral venue 5,000 miles from their facility. The designated away team faces the same travel but without even the nominal home designation. Both teams are disrupted, and the schedule around the London fixture matters enormously. A team that plays in London in Week 5 and then returns to the US for a short-week game in Week 6 is at a compounding disadvantage that the market does not always price efficiently.
My process: before each NFL week, I check the rest differential for every game. I flag any game where the differential is three or more days, and I look at those games first. If the spread aligns with the rest advantage, I investigate further. If it contradicts it, I want to understand why — usually an injury or a severe talent gap. The schedule is the most objective, most quantifiable edge in NFL betting, and it is sitting in the public domain every August when the league publishes the fixture list.
Bankroll Management: Unit Sizing and Staking Plans
I once watched a friend — a smart, analytical person — blow through his entire NFL season bankroll by Week 4. He was right on 60% of his picks. His problem was not accuracy; it was that he staked 20% of his bankroll on each bet and hit a three-game losing streak in Week 3. The maths killed him before his skill could save him.
Bankroll management is the least glamorous topic in betting strategy and the most important one. It is the difference between surviving a bad month and being wiped out by one. The principle is simple: determine a fixed unit size as a percentage of your total bankroll, and never deviate from it based on confidence, frustration, or a hot streak.
The standard recommendation among professional bettors is a unit size of 1-3% of your total bankroll. If you have GBP 1,000 set aside for NFL betting over a season, one unit is GBP 10-30. Every bet you place risks one unit. If you have a particularly strong opinion on a game — say, a rest advantage combined with a key number — you might go to 2 units. You never go to 5. You never go to 10. The reason is variance. Even a bettor who wins 55% of their spread bets — a genuinely excellent long-term record — will experience losing streaks of five, six, even eight games. A 1-2% unit size lets you absorb those streaks without catastrophic damage.
Since February 2026, UK affordability checks kick in at a threshold of GBP 150 in net losses per month for the initial frictionless check. Sarah Chen, a compliance director at a major UK gambling company, has described the shift in operator thinking — moving from reactive harm prevention toward predictive financial protection. For bettors, this regulatory framework actually reinforces good bankroll discipline. If your staking plan is calibrated correctly, you should rarely approach the affordability threshold in a single month. If you are hitting it regularly, your unit size is too large relative to your bankroll, or your bankroll is too large relative to your disposable income. The two are related.
Flat staking — risking the same amount on every bet — is the simplest and most robust approach for most NFL bettors. Variable staking (sizing bets according to perceived edge) can improve returns, but only if your edge estimation is accurate. Most recreational bettors overestimate their edge, which means variable staking amplifies losses rather than gains. My advice for anyone in their first two seasons of serious NFL betting: flat stake at 1% per bet, track your results meticulously, and revisit your staking plan only after you have a full season of data to evaluate.
Line Shopping Across UK Bookmakers
If you only do one thing after reading this guide, make it this: open accounts with at least three UKGC-licensed bookmakers and compare NFL odds before every bet. Line shopping is the closest thing to free money in sports betting. It requires no skill, no model, no insider knowledge — just the willingness to spend thirty seconds checking whether 1.95 is available elsewhere when your first platform shows 1.87.
The UK sports betting market generates approximately GBP 2.48 billion in annual gross gambling yield, and that revenue comes from margins that vary between operators. One platform’s overround on an NFL moneyline might be 4%; another’s might be 6%. The practical effect is that the same bet — the same team, the same game, the same outcome — pays differently depending on where you place it. Over a season of 100+ bets, consistently taking the best available price across three platforms can add several percentage points to your overall return without requiring a single additional winning pick.
The mechanics are simple. On Tuesday or Wednesday, when NFL lines open for the coming week, note the spreads and moneylines on your primary platform. Then check two others. If the spread on your primary is -3 at 10/11 and another platform offers -3 at evens, take the evens. If the moneyline favourite is 1.65 on one site and 1.71 on another, take 1.71. You are not predicting the game differently — you are ensuring that your correct predictions pay the maximum amount.
Line shopping is especially valuable around key numbers. A spread of -3 at one bookmaker and -2.5 at another is not just a half-point difference — it is a structural difference, because -3 is the most common final margin in NFL. Taking -2.5 instead of -3 eliminates the push risk and transforms a narrow loss into a win on every game that lands on exactly three points. That single half-point can be worth more than a percentage point of long-term return.
One practical note: some UK operators restrict or limit accounts that consistently take early prices and win. This is an industry-wide issue, not unique to NFL. If you notice your maximum stake being reduced on a particular platform, it is a signal that the bookmaker has identified you as a sharp bettor. The response is not to stop shopping — it is to diversify across more platforms and to look for edges in markets where bookmaker pricing is less refined, such as weather-affected totals where venue and conditions create genuine mispricings.
Situational Spots: Lookahead, Letdown and Revenge Games
Week 11, 2022. I had the Kansas City Chiefs as a strong play against the Los Angeles Chargers — the numbers were right, the matchup favoured Kansas City, the spread was reasonable. What I missed was context. The Chiefs had just demolished a rival in a Sunday night thriller, and the Chargers game was sandwiched before a Thanksgiving showdown against the Rams. Classic letdown spot meets lookahead spot. Kansas City came out flat, did not cover, and I learned a lesson I should have learned earlier: the spreadsheet does not capture what is happening between a team’s ears.
Situational betting in the NFL is pattern recognition applied to context. It is not voodoo. It is not “this team always wins on Monday night.” It is identifying repeatable scenarios where one team’s focus, preparation, or motivation is measurably different from the opponent’s — and the market has not fully adjusted for that difference.
The lookahead spot is the clearest example. A team playing a weak opponent in Week 10 with a marquee divisional rivalry scheduled for Week 11 faces a natural temptation to look past the current game. Coaches deny it. Players deny it. The data does not deny it. Teams in lookahead spots historically underperform the spread by a small but consistent margin, particularly when the upcoming game is against a rival or has playoff implications. The edge is modest — typically 1-2 points of spread value — but it is real and it compounds across a season.
The letdown spot is the inverse. A team that has just won a dramatic, emotionally intense game — a last-second victory, a playoff-clinching win, a dominant performance against a rival — often comes out flat the following week. The emotional peak has been reached, and the human body’s response is to relax. Again, coaches fight it. Again, the data shows it happens. Letdown spots are most powerful when paired with a short rest period or a travel disadvantage.
Revenge games are the trickiest situational spot because they are the most susceptible to narrative bias. The theory is that a team that suffered a blowout loss earlier in the season will be extra motivated when the rematch arrives. Sometimes this is true. More often, the market already prices in the revenge narrative because the media has been discussing it all week. A revenge game where the spread has not moved to reflect the narrative might offer value. A revenge game where the line has already shifted two points because every pundit in Britain and America has flagged it? Probably not.
The discipline with situational spots is to treat them as one input among many, not as a standalone system. A lookahead spot combined with a rest disadvantage and a key number is a strong confluence. A lookahead spot on its own, with no other supporting factors, is a data point that might nudge your decision but should not drive it. I flag situational spots in my weekly analysis, note them alongside schedule and rest data, and only act when multiple factors align.
Closing Line Value: Measuring Whether You Beat the Market
Here is a question that most bettors never ask themselves: did I beat the closing line? Not did I win the bet — did the price I locked in turn out to be better than the price the market settled on at kickoff? This metric, called closing line value (CLV), is the single best predictor of long-term betting profitability, and it does not require you to win any specific bet to measure.
The concept is straightforward. You place a bet on Tuesday at a spread of -3. By Sunday kickoff, the line has moved to -4.5. You got the better number. Even if your bet loses this particular week, the fact that you consistently obtained prices that the market later moved towards is evidence that your analysis is leading the market rather than following it. Over hundreds of bets, positive CLV translates to positive profit — not on every bet, but on the aggregate.
Live betting’s share of online wagering revenue has surpassed 62%, which means a huge volume of money flows into NFL games after the pre-game line closes. But for pre-game bettors, the closing line remains the benchmark. Professional betting syndicates track CLV as obsessively as hedge funds track alpha. If their bets consistently close at prices worse than what they obtained, they know their models are working — regardless of short-term results.
For a UK punter betting 50-100 NFL games per season, tracking CLV is simpler than it sounds. Record three numbers for every bet: the price you got, the closing line, and the result. After a season, calculate what percentage of your bets had positive CLV (you got a better price than the close). If that number is above 50%, you are doing something right, even if your win-loss record is mediocre in the short term. If it is below 50%, your timing or analysis needs adjustment — you are consistently taking prices that the market corrects against you.
CLV is not a magic number. It does not guarantee profit in small samples. But it is the most honest measure of whether your approach is sound, and it removes the noise of individual game outcomes from the evaluation. Win or lose, did you beat the market? That is the question that separates process-driven bettors from results-driven ones.
What Doesn’t Work: Popular NFL Betting Myths
I spent the first two years of my NFL betting life chasing a system that would tell me who wins on Monday Night Football. There had to be a pattern — home teams on primetime, dome teams in cold weather, West Coast teams travelling east for early kickoffs. I tracked every angle I could find. The result? A spreadsheet full of noise and a bankroll that went sideways at best. Those two years taught me more about what does not work than any winning streak ever could.
Punters looking to apply these data-driven edges should only register with the best NFL betting sites in the UK to ensure fair odds.
The “always fade the public” myth is the most persistent. The theory sounds logical: casual bettors pile onto popular teams, so the contrarian move is to bet against public sentiment. In practice, bookmakers do not set lines based purely on balancing public money. They employ traders who set accurate lines first, and the line moves that occur are often driven by sharp money, not recreational volume. Blindly fading the public is no more strategic than blindly following it. The market is too efficient for a rule that simple to produce consistent edge.
Hot and cold streaks are another trap. A team that has won four straight against the spread feels like a safe bet. A team on a five-game losing streak feels due for a bounce. Neither feeling has predictive value. NFL outcomes against the spread are close to random from week to week — each game is its own event with its own injury report, its own matchup dynamics, its own weather conditions. Streak-based betting is pattern recognition applied to coin flips. The patterns are real in the past data. They have no predictive power for the next game.
System betting — “bet the under in divisional games in December” or “take the road underdog off a bye” — belongs in the same category. Every testable NFL system sounds compelling because somebody has mined decades of data to find it. The problem is overfitting. With enough variables, you can find a historical pattern for anything. The question is whether that pattern reflects a genuine, repeatable market inefficiency or a statistical coincidence. Most of them are coincidence, and the ones that were once genuine have been arbitraged away by a market with billions of dollars in annual handle. That volume of money is very good at eliminating simple edges.
The hardest myth to abandon is the idea that more information equals better bets. UK punters who wake up at 5 AM to watch NFL Network, follow every beat reporter on social media, and read three different injury reports before placing a bet are not necessarily making better decisions than someone who checks the line and the key numbers. Information overload leads to overthinking, and overthinking leads to second-guessing a sound process. The goal is not to know everything — it is to know the right things and act on them with discipline.