My first NFL prop bet was a disaster dressed up as genius. Week 3, 2018. I had watched a running back demolish a bottom-ranked rush defence the previous week and took the over on his rushing yards at 85.5. He got injured on the second drive. Twelve yards, game over, money gone. The bet was not wrong in the traditional sense — my analysis of matchup and workload was sound — but props have a brutal honesty about them. They are binary, they are specific, and they do not care about your reasoning if the player leaves the field in the first quarter.
That experience did not stop me from betting props. It taught me how to bet them. Eight years later, player and game props account for roughly a third of my NFL betting activity, and they are the area where I find the most consistent mispricing from UK bookmakers. The reason is structural: props are harder for bookmakers to price than spreads and totals because they depend on individual performance, not team outcomes. A bookmaker can model team strength with decades of data; modelling whether a specific tight end will catch five passes requires a different, more granular toolkit — one that many UK operators have not fully developed for American football.
The NFL prop market has exploded alongside the broader growth in legal wagering, which now exceeds $30 billion per season across US-licensed operators. In the UK, where roughly 10% of adults bet regularly, NFL props have gone from a niche curiosity to a standard offering on every major platform. This guide breaks down the main prop categories, how they are priced, and where a disciplined bettor can find edges that the main markets do not offer.
Player Props: Passing, Rushing and Receiving Markets
I keep a folder on my laptop labelled “mismatches” — screenshots of matchup data from games where the yardage prop line missed the mark by a wide margin. Over time, that folder has become my most reliable teaching tool, because the patterns repeat. The three yardage markets — passing, rushing, and receiving — are the bread and butter of NFL player props, and they are where I spend most of my time. Yardage is the most predictable individual metric in football. A quarterback who averages 260 passing yards per game is not going to throw for 400 one week and 120 the next with any regularity. The variance exists, but it is bounded by game script, opponent quality, and offensive scheme in ways that touchdowns and other counting stats are not.
Passing yards props are the most liquid and the most efficiently priced. If a bookmaker sets Patrick Mahomes’ passing yards line at 275.5, that number has been calibrated against his season average, his opponent’s pass defence ranking, the weather forecast, and the expected game script. Beating this market consistently is difficult, though not impossible. The edges tend to appear in two situations: games with a high projected total where the bookmaker has not fully adjusted the quarterback’s yardage line upward, and games involving a backup quarterback where the bookmaker has overcorrected downward based on name recognition rather than scheme fit.
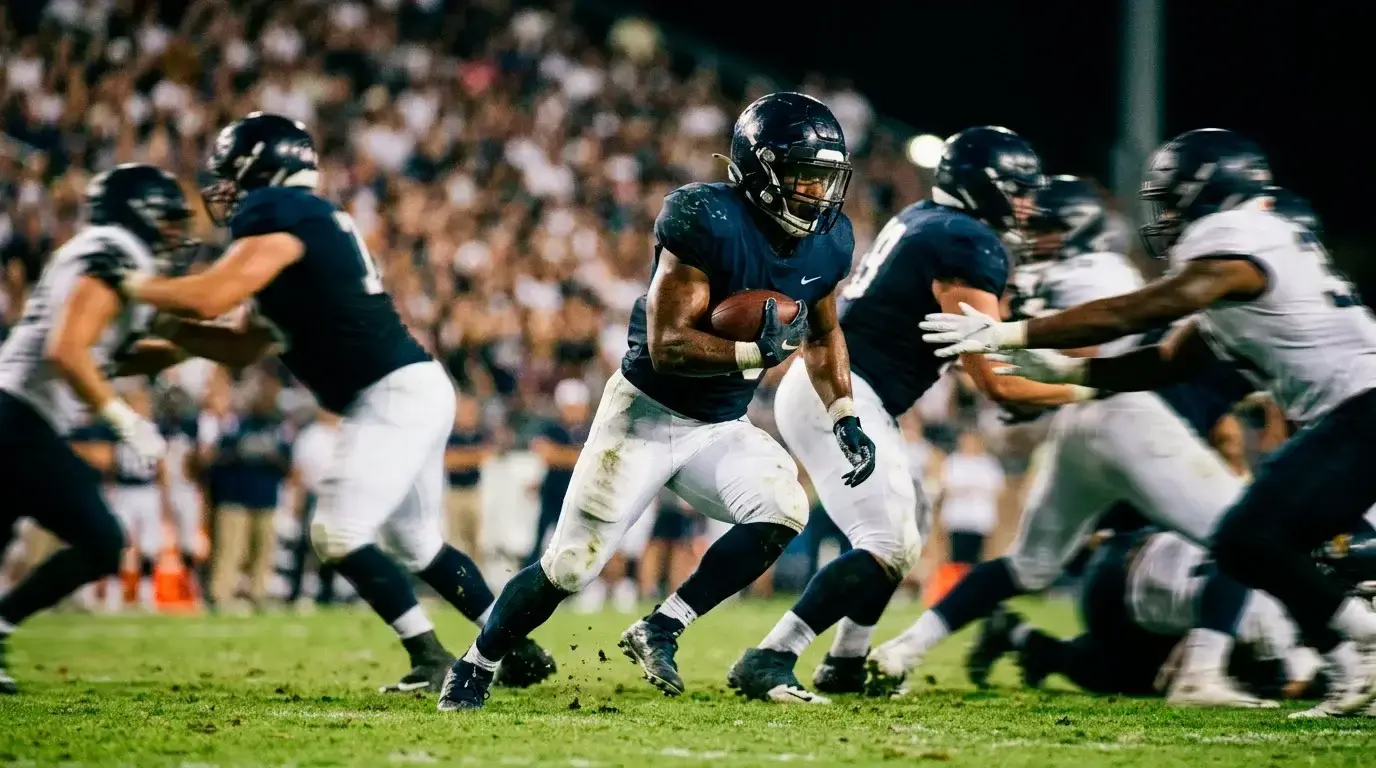
Rushing yards props offer more variance and more opportunity. Running back usage in the NFL is notoriously committee-based — in 2026, fewer than half of NFL teams have a true every-down back who handles 70% or more of carries. This means the bookmaker has to estimate not just how many yards a back will gain per carry, but how many carries he will receive. When a team’s offensive coordinator shifts the game plan based on a matchup — running more against a weak front, passing more against a vulnerable secondary — the actual carry count can deviate significantly from the season average.
Receiving yards are where I find the most mispricing. The reason: receiving yards depend on a chain of events — targets, catches, yards after catch — each of which has its own variance. A receiver might average 6 targets per game but see 10 against a team that plays a specific coverage scheme forcing throws to his side of the field. UK bookmakers, particularly mid-tier operators, sometimes set receiving lines based on simple season averages without adjusting for the opponent’s defensive tendencies. Checking which cornerback will line up against your target receiver, and how many yards that cornerback has allowed this season, is a ten-minute exercise that can reveal genuine value.
A practical example: suppose a wide receiver averages 68 receiving yards per game, and the bookmaker sets the line at 64.5. That looks like a tight over. But if this week’s opponent has allowed the second-most yards to wide receivers and the game has a projected total of 52, the true expectation might be closer to 80. The market is anchored to the season average; you are trading on the matchup-specific projection. That gap is where prop value lives.
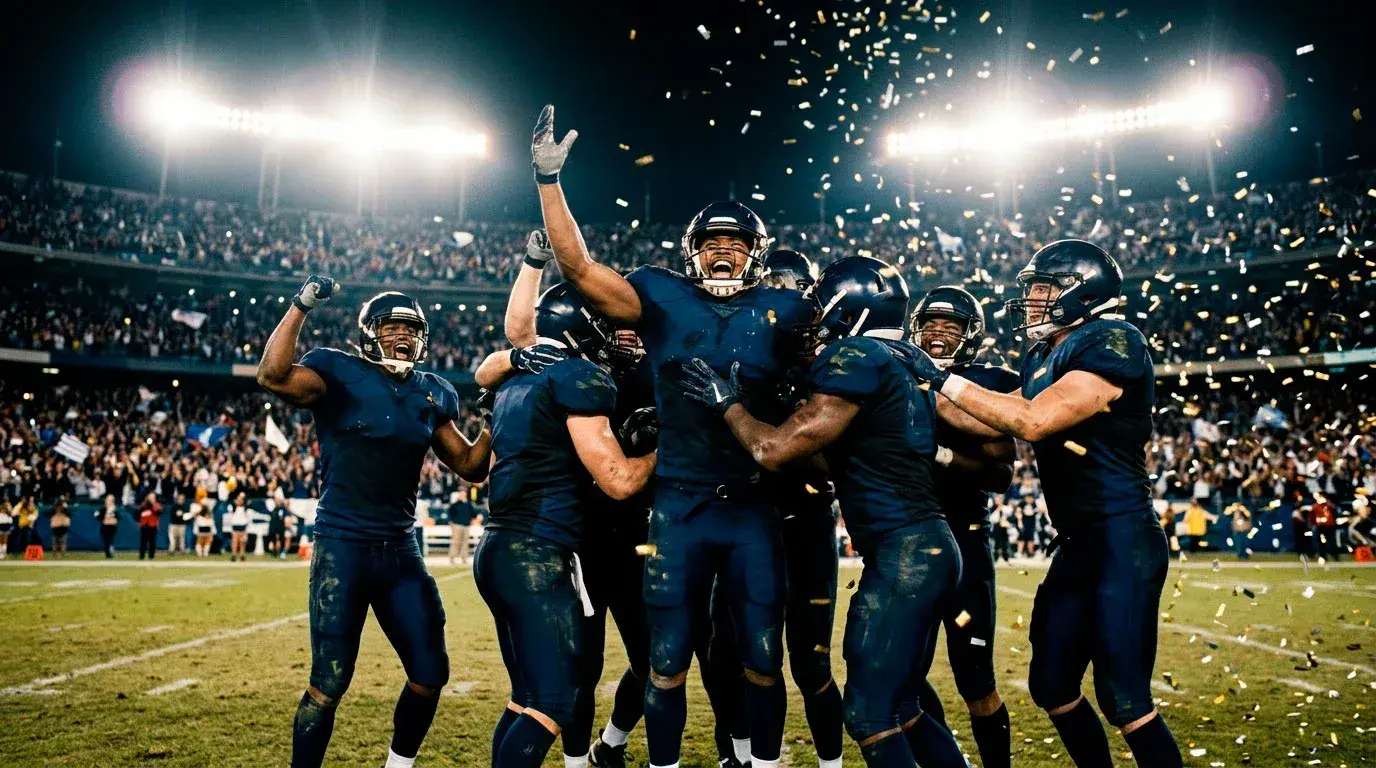
Touchdown Scorer Markets: Anytime, First and Last
There is something deeply satisfying about calling a first touchdown scorer. You pick a name, the game kicks off, and within the first ten minutes either you look like a genius or you spend the next three hours hoping for garbage-time redemption. It is the most emotionally engaging prop category and, not coincidentally, the one with the widest margins for bookmakers.
Three variants exist on most UK platforms. Anytime touchdown scorer is the most popular: your player scores at any point during the game, you win. First touchdown scorer pays significantly more because it requires not just a score but the first one — a single event in a 60-minute contest. Last touchdown scorer is the rarest offering, available on fewer platforms, and carries similarly long odds. Each variant has different risk and different value characteristics.
Anytime touchdown scorer is the most analysable. The question is simple: will this player score at least one touchdown? The key inputs are red-zone target share (for receivers and tight ends), red-zone carry share (for running backs), and the opponent’s red-zone defence efficiency. A running back who handles 80% of his team’s goal-line carries against a defence that allows the fifth-most rushing touchdowns in the league is a strong anytime candidate. The odds on that player will reflect some of this, but not always all of it — particularly early in the season when sample sizes are small and bookmakers are relying on pre-season projections.
First touchdown scorer is closer to a lottery ticket. The median NFL game sees its first touchdown on the second or third possession, and which team possesses the ball first is a coin flip determined by the opening toss. If the away team wins the toss and defers (as most teams do), the home team’s skill players have the first crack at the end zone. This gives home-team running backs and primary red-zone targets a structural advantage in first-scorer markets that is often underpriced. The average first-scorer price for a home team’s starting running back is typically around 8/1 to 10/1, but the implied probability rarely accounts fully for the possession advantage.
My approach to touchdown markets is selective. I bet anytime touchdowns when the matchup data aligns strongly — high-volume red-zone players against poor red-zone defences. I treat first-scorer bets as small-stake speculative plays, never more than half a unit. And I avoid last-scorer bets entirely, because the variance is too high and the pricing too opaque. Knowing which markets to skip is as important as knowing which to play.
Game Props: Totals, Margins and Half-by-Half Markets
Player props get the headlines, but game props are where the analytical bettor can build a portfolio of uncorrelated positions across a full slate of games. Totals, margins, and half-by-half markets are all game-level props, and each tells you something different about how the bookmaker expects the contest to unfold.
Total points — the over/under — is familiar to most UK bettors, even those who have never touched American football. The bookmaker sets a number; you decide whether the combined score will be higher or lower. What makes NFL totals interesting is the sport’s scoring structure. Points come in chunks of three (field goals), six or seven (touchdowns with or without conversions), and two (safeties, two-point conversions). This means that certain total numbers are more “natural” than others. A total of 44 sits on a number that many NFL games land on — six touchdowns and a field goal apiece, for example. A total of 38.5 is lower than the league average and implies a defensive or weather-affected game. Understanding the scoring arithmetic helps you evaluate whether a total is set at a natural landing point or in a gap between common outcomes.
Winning margin markets ask you to predict the exact margin or the margin band (1-6 points, 7-12 points, 13-18 points, and so on). These are inherently high-variance, but they reward understanding of key numbers. NFL games end on margins of 3 and 7 far more often than any other numbers, which means the 1-6 band and the 7-12 band carry different underlying probabilities than their prices might suggest. A margin of exactly 3 occurs in roughly 15% of all NFL games — a single number accounting for that much of the distribution is remarkable, and it means the 1-6 band is heavily loaded towards its upper end.
Half-by-half markets break the game into first-half and second-half segments, each with its own spread and total. First-half totals tend to run lower than second-half totals, partly because coaches are more conservative early and partly because the two-minute offence at the end of the second quarter can produce rapid scoring. If you have a view on a game’s pace but not its outcome, first-half totals let you express that view over a shorter, less variable time horizon. The trade-off is thinner markets and wider margins compared to the full-game total.
I mix game props into my weekly betting alongside spreads and moneylines, treating them as separate, uncorrelated positions. If I have a spread bet on a game, I avoid adding a total bet on the same game unless I have independent analysis supporting both. Correlated bets feel diversified but are not — a blowout that covers the spread often pushes the total over as well. Genuine diversification means spreading your positions across different games and different prop types.
How UK Bookmakers Price NFL Props Differently
Last November, I pulled up the same player prop on four UK platforms and found a spread of nearly 20% in the implied probability across them. Same player, same game, same market — four different prices. That is not an anomaly. It is a feature of how UK bookmakers approach NFL props, and it is the single biggest reason prop betting in the UK can be more profitable than prop betting in the US.
The explanation is structural. US sportsbooks operating in states with legal wagering — a market growing at 8.5% annually — have invested heavily in NFL pricing models. They employ dedicated NFL traders, ingest play-by-play data feeds, and adjust lines in real time based on sharp action. UK bookmakers, by contrast, treat the NFL as a secondary sport. Their primary pricing expertise is in football, horse racing, and tennis. NFL prop lines are often derivative — set by referencing US lines, converting the odds to decimal, and adding a margin — rather than independently modelled.
This derivative pricing creates predictable inefficiencies. When a US line moves because of sharp action (say, a rushing yards line drops from 75.5 to 69.5 because a key offensive lineman is ruled out), UK platforms may lag the update by hours. During that window, the stale UK price offers genuine value. Jamie Reynolds, a sports marketing executive who has worked across UK and international markets, once observed that British fans are less tribal about American sports, which means they approach NFL betting with fewer emotional biases than US bettors — but fewer informational advantages too. The pricing lag partially compensates for that information gap, giving the UK bettor who does their homework a window that does not exist in more liquid US markets.
Another pricing difference: UK bookmakers typically set wider overrounds on NFL props than on NFL spreads or Premier League markets. An overround of 8-12% on a two-way NFL prop (over/under on rushing yards, for example) is common, compared to 4-6% on the same game’s spread. The wider overround means the bookmaker is building in more protection, which also means the break-even win rate for prop bettors is higher. You need to be right more often to profit. Line shopping across multiple platforms — the same principle that applies to Super Bowl betting — is even more critical in props, because the price variation between operators is larger.
One practical tip: check the time a UK platform last updated its NFL prop lines. Some operators adjust early in the week and do not revisit until the day before the game. Others update continuously. If a platform’s passing yards line has not moved since Tuesday but the starting wide receiver was ruled out on Thursday, that stale line may offer value on the under. The information is public; the price has not absorbed it yet.
Building a Prop Research Process from Box Scores
You do not need a data science degree to research NFL props. You need a box score from last week, a depth chart, and thirty minutes on a Saturday morning. That is the process I have used for years, and it works because props reward specific, narrow knowledge more than broad football understanding.
Step one: pull the box score from the player’s last three games. Not the season average — the last three. Season averages smooth out the kind of recent-form shifts that prop lines sometimes miss. If a wide receiver averaged 5 targets per game in September but has seen 9, 11, and 8 in October, his role has expanded. The bookmaker’s line might still be anchored to the season average of 6.5. The last three games tell a different story.
Step two: check the opponent’s defensive rankings against the relevant position. This is freely available on any NFL statistics site. You want two numbers: yards allowed per game to the position, and targets or attempts allowed. If the opponent ranks bottom-five in yards allowed to wide receivers, your expanded-role receiver is facing a soft matchup. If the opponent ranks top-five, even an increased target share might not translate to yardage because the coverage is tighter.
Step three: look at the injury report. Not the headline injuries — everyone knows if the starting quarterback is out. Look at the secondary injuries: the backup guard who was limited in practice, the slot cornerback on the opposing defence who is questionable. These peripheral injuries are often the difference between a prop line that is priced correctly and one that has not adjusted. UK platforms serving an audience where 76% of 18-24 year-old bettors use mobile phones often streamline their injury reporting, burying the depth of the injury report behind a single “key injuries” headline. Go deeper.
Step four: compare the prop line to your projection. If the bookmaker sets the receiving yards at 55.5 and your three-game trend plus matchup analysis suggests 70, that is a strong over. If the number is 55.5 and your analysis says 58, that is a marginal over — too thin to bet, given the overround. The threshold I use: if my projection differs from the bookmaker’s line by more than 15%, I consider the bet. Below 15%, the overround eats the edge.
This four-step process takes twenty minutes per player. I run it on three to five players per week, selecting candidates based on matchup flags from the defensive rankings. By mid-season, the process is almost mechanical — but the mechanical discipline is what keeps it profitable. Bettors who watch around 19 more NFL games per season than non-bettors are building pattern recognition that feeds directly into this kind of analysis. The box score is the raw data; the watching is the interpretive layer.
When Props Go Wrong: Variance, Small Samples and Trap Lines
If you are going to bet NFL props, you need to make peace with variance. Not in the abstract, “yes, I understand randomness” sense, but in the concrete, “I lost seven prop bets in a row and my process was correct” sense. Props are small-sample bets on individual performances, and individual performances are inherently noisier than team outcomes. A quarterback who averages 270 yards per game can throw for 180 on any given Sunday because his offensive line got bullied, or the wind picked up, or the opposing coordinator schemed a coverage he had never seen before. Your analysis was right. The outcome was not. This is normal.
Trap lines are the other hazard. A trap line is a prop that looks generous but has a hidden structural reason for its price. The classic NFL trap: a running back’s rushing yards line is set at 55.5 when he has been averaging 80. The price looks like a screaming over. But the game is projected as a blowout, which means his team will likely be trailing early and abandon the run game. The bookmaker priced the line low because the game script — not the player’s talent — dictates the opportunity. An 18.7-million average NFL viewership means that game-script analysis is baked into the US-facing market almost instantly. UK lines may lag, but they are not set by fools. If a prop line looks too good, it usually is.
Small sample sizes compound the variance problem. In a 17-game NFL regular season, a player who misses two games gives you 15 data points for the entire year. Fifteen observations is not enough to separate skill from noise for most statistical analyses. You can identify trends — increased target share, expanded role, favourable schedule stretch — but you cannot confirm them with the kind of confidence that, say, a 162-game baseball season provides. Props reward conviction built on process, not conviction built on sample size.
The affordability framework in the UK adds another dimension. With initial frictionless checks applying at GBP 150 in net losses per month since February 2026, prop betting — which tends to involve higher-frequency, lower-stakes positions — can approach that threshold faster than traditional spread betting. Sarah Chen, a compliance director at a major UK gambling company, has spoken about the industry’s shift from reactive harm prevention toward predictive financial protection, and the affordability framework is a practical expression of that philosophy. For prop bettors, the implication is straightforward: size your prop bets smaller than your spread bets. I use half-units on most props and full units only when the projection gap exceeds 20%. The combined effect of wider overrounds, higher variance, and regulatory thresholds means that discipline in staking is more important in props than in any other NFL market.
None of this should discourage you from prop betting. It should calibrate your expectations. Props are not a path to rapid profit. They are a path to slow, incremental edge extraction in a market that most UK bettors — and many UK bookmakers — do not analyse as rigorously as the main NFL lines. The edge exists. Capturing it requires patience, process, and a tolerance for losing weeks that would make a spread-only bettor flinch.